Transaction Summary Report
The Transaction Summary Report offers an in-depth look at your business's performance over a set period, highlighting daily sales and reversals.
This report excludes test transactions. For a more detailed breakdown of transactions, see Transaction Detail Report.
Generating a Transaction Summary Report
-
Access the Merchant Portal: https://mp.segpay.com/
-
Navigate to the Report: Got to
Performance Reporting >Transaction Summary Report .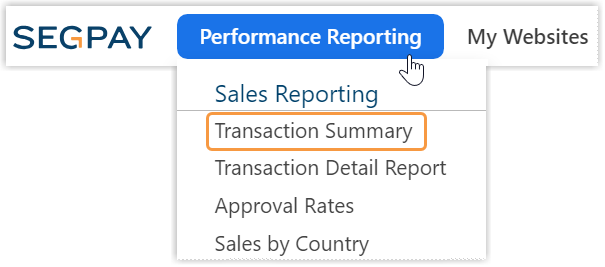
-
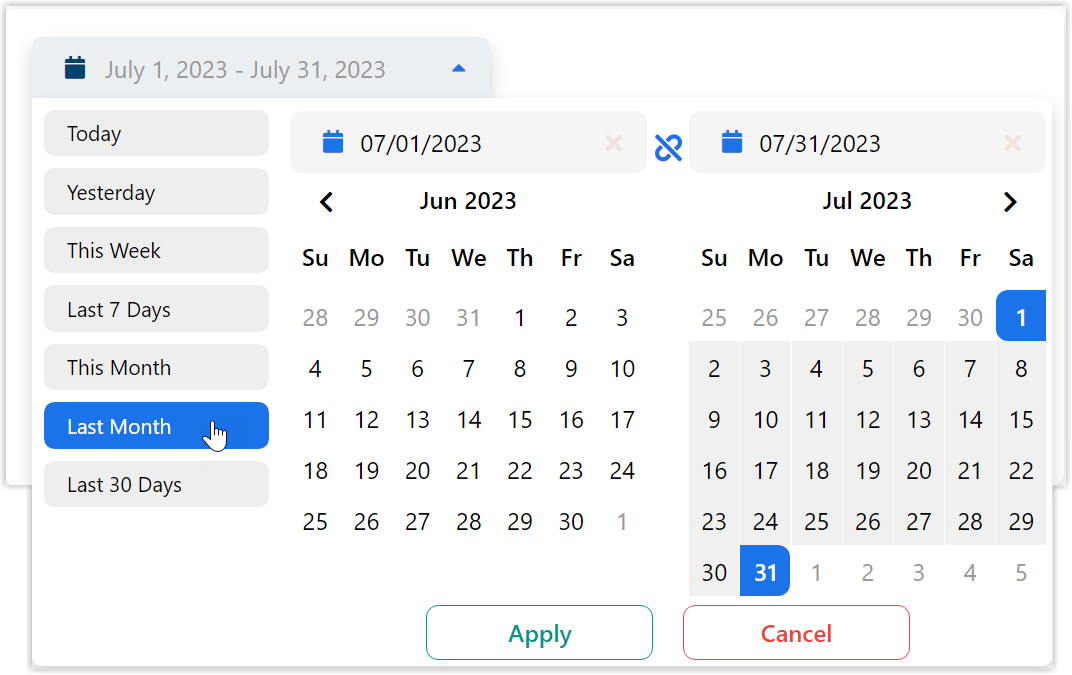
Define Date Range:
-
Click the date-selector box.
-
Options include: Today, Yesterday, This Week, Last 7 Days, This Month, Last Month, Last 30 Days, or Custom Range (set start and end dates).
-
-
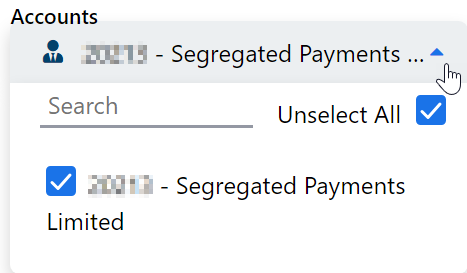
Select Merchant Account: Choose the merchant account(s) for the report.
-
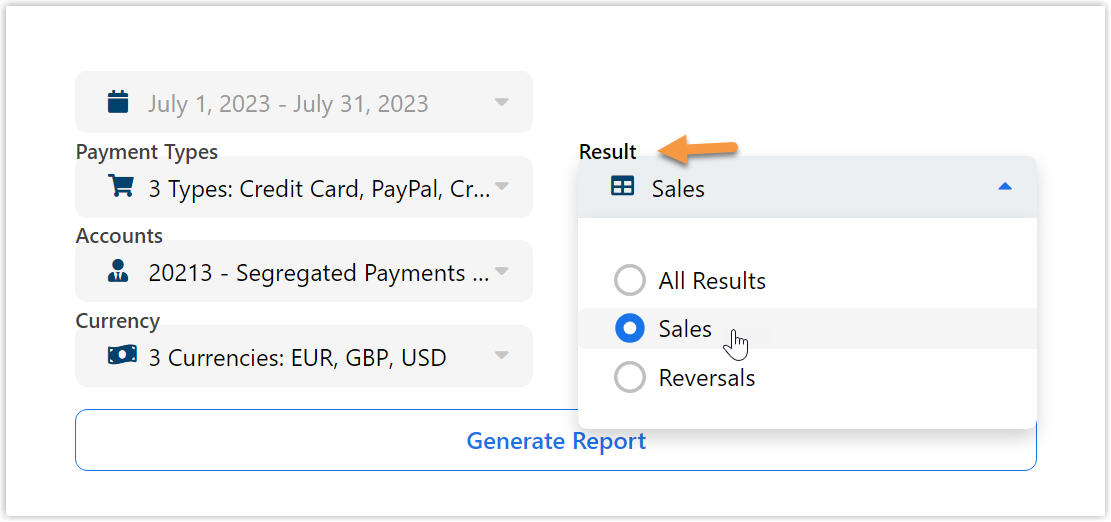
Select Result: Choose between"All Results," "Sales," or "Reversals."
-
Sales include: Signups, Conversions, Instant Conversions, Rebills, One-Clicks
-
Reversals include: Refunds, Voids, Chargebacks, Revokes, Declines
-
-
Select Currency:
-
Reports with multiple currencies show a combined total.
-
For specific currency totals, choose one currency.
-
-
Generate the Report: Click the Generate Report button.
$0.25 Adjustment: You might see a $0.25 adjustment on some transactions. This is from our Card Updater service, which automatically checks if your customers' card details (like expiration dates) have changed. This helps prevent failed payments and ensures successful transactions. You won't be charged for these checks, and they won't show up on your Transaction Summary report.
Customizing Report Results
Date Selector
Use the dropdown date selector for most reports. Set a specific range or use quick select options.

Save Report Filters
Save report filter choices for quick future access.
-
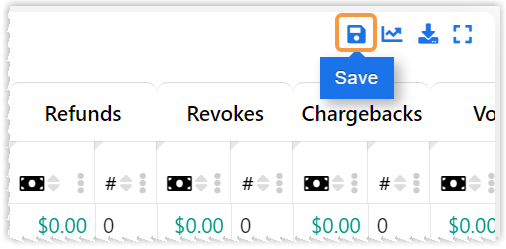
Click the floppy disk icon.
-
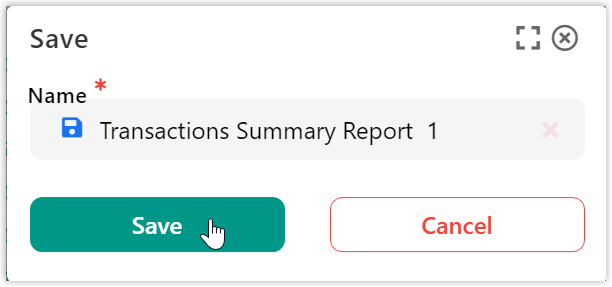
Name the filter and click Save.
-
Overwrite, rename, or delete filters as required.
Downloading
Download reports in CSV, XSLX, or PDF.
-
Click the download icon.

-
Name the report and select a format.

-
Click the Download button.
Large reports might be emailed as zip archives.
Chart Views
After generating a report, click the chart icon to view your data as a chart.
![]()
Change your chart view by selecting options from the drop-down menus.

Data Filtering
Reports are presented in grid format. Use built-in controls for filtering and sorting. Utilize page controls and scroll bars for navigation.


